We look at how often states have flipped from one party to the other, how close their elections have been, and how recently they have been swinging to arrive at a ranking of the ‘swingy-ness’ of swing states.
Even among the purple states, which ones are more purple than others? Can we find out the swingiest or purplest states of them all?
As the 2024 US Presidential election draws closer, both Joe Biden and Donald Trump will be paying special attention to wooing voters from the swing states, states which do not consistently vote red (Republican) or blue (Democrat) but rather, often swing from one party to the other, giving them the tag of being purple states.
But which states swing more than others? Even among the purple states, which ones are more purple than others? Can we find out the swingiest or purplest states of them all?
Over the course of this article, we try to quantify the ‘swingy-ness’ of swing states, or the purpleness or purple states. We will look at how often the states have flipped from one party to the other, how close their elections have been, and how recently they have been swinging - all of it, to arrive at a ranking of the swingy-ness of swing states.
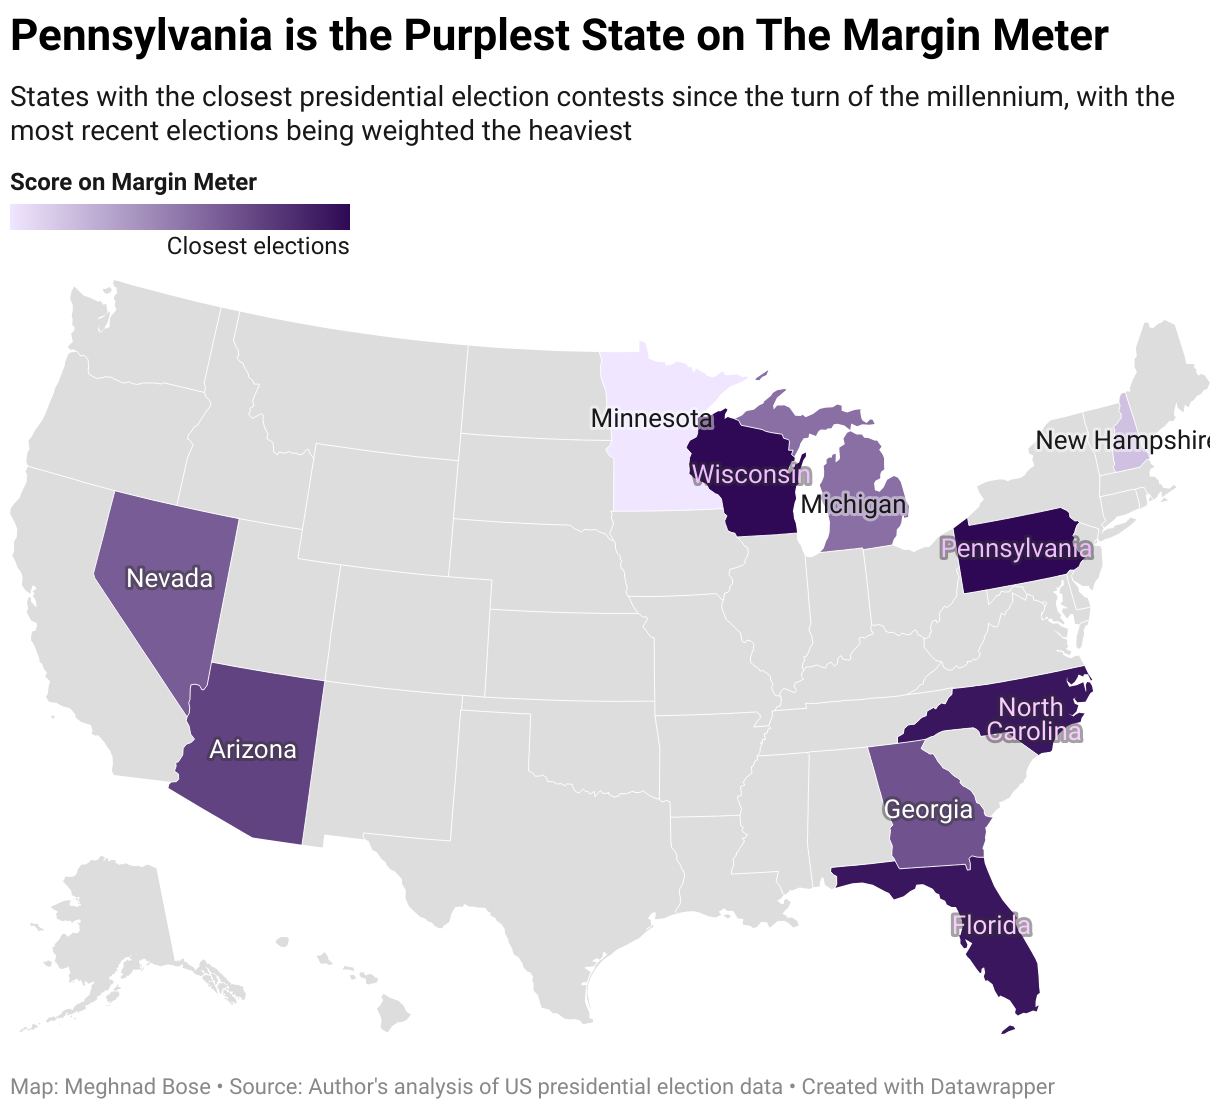
Does the margin of each previous election matter equally? To estimate how swingy a state is today, it would be fair to say that the swingy-ness ‘form’ of a state matters too - hence, let’s give the greatest weightage to the most recent presidential election.
In our metric, therefore, 2020 was given the most weightage and each election before that was progressively given lesser and lesser weightage.
- To do this, the victory margin percentage between Joe Biden and Donald Trump in 2020 was multiplied by 50.
- The victory margin percentage between Donald Trump and Joe Biden in 2016 was multiplied by half of 50, or 25.
- The victory margin percentage between Barack Obama and Mitt Romney in 2012 was multiplied by half of 25, or 12.5.
- And so on, till the election in 2000 in which George W. Bush beat Al Gore. The victory margin percentage in that election was multiplied by 1.5625.
The sum of these scores for each state gave the Margin Meter score for that state.
You can read more about the methodology here.